Linear Regression
Finding the "Best" Line
A common choice for linear regression is ordinary least squares (OLS).
y = mx + b + error

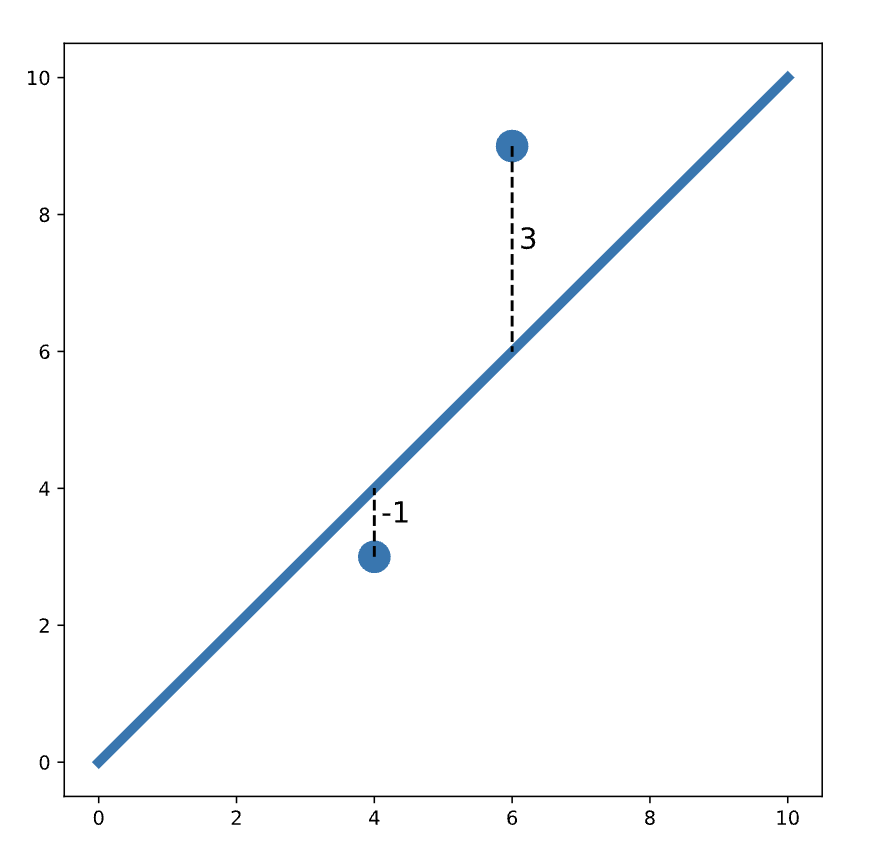
We define "best" as the line that minimizes the total squared error for all data points.
This total squared error is called the loss function in machine learning.
loss = (-1)^2 + (3)^2 = 1 + 9 = 10
Fitted and Residual Values

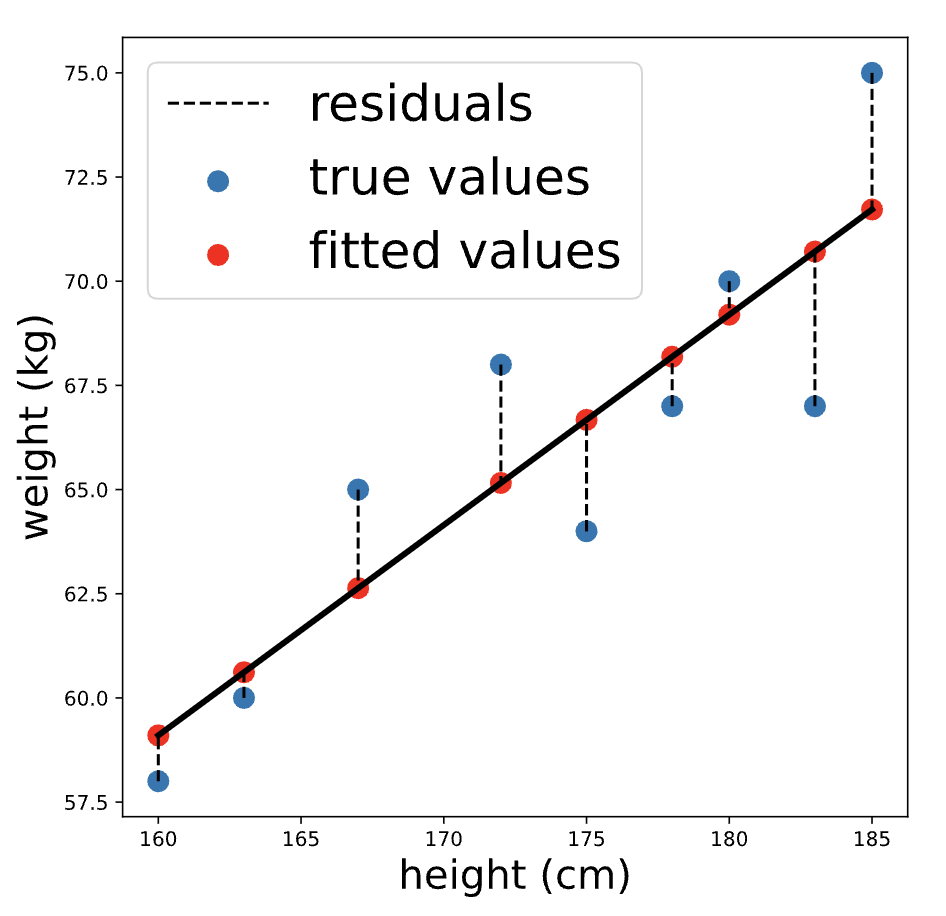
The fitted values are the predicted weights for each person in the dataset that was used to fit the model, while the residuals are the differences between the predicted weight and the true weight for each person
Assumptions of Linear Regression
Linear Relationship
The relationship between the outcome variable and predictor is linear (can be described by a line). We can check this before fitting the regression by simply looking at a plot of the two variables.
Once we’ve calculated the fitted values and residuals for a model, we can check the normality and homoscedasticity assumptions of linear regression.
Normality
The normality assumption states that the residuals should be normally distributed.
# To check this assumption, we can inspect a histogram of the residuals
# and make sure that the distribution looks approximately normal
# -- no skew or multiple “humps”.
plt.hist(residuals)
plt.show()
Homoscedasticity
Homoscedasticity — residuals have equal variation across all predictor variables.
# A common way to check this is by plotting the residuals against the fitted values.
# If the homoscedasticity assumption is met, then this plot will look
# like a random splatter of points, centered around y=0.
#
# If there are any patterns or asymmetry, that would indicate the assumption is NOT met
# and linear regression may not be appropriate.
plt.scatter(fitted_values, residuals)
plt.show()
Example Python Code
import statsmodels.api as sm

# Read in the data
students = pd.read_csv('test_data.csv')

# Create the model here:
model = sm.OLS.from_formula('score ~ hours_studied', data = students)

# Fit the model here:
results = model.fit()

# Print the coefficients here:
print(results.params)

# Fitted & residuals example
fitted_values = results.predict(body_measurements)
residuals = body_measurements.weight - fitted_values # AKA actual values less fitted values